⚡ Quick Answer
Gold rate prediction shows gold has roughly 2.5x in 10 years in India – from ~₹2,800/g (24K) in May 2016 to ~₹7,800/g (24K) in May 2026 – an average annual appreciation of ~10.7%. Gold price next 5 years projections from analysts range from 6–10% per year. Gold price next 10 years projections cluster around 7–9% per year, supported by central bank buying, currency depreciation, and geopolitical demand. Key drivers of gold rate increase reasons: USD weakness, rupee depreciation, inflation hedging, central bank reserves, and supply constraints. Past performance doesn’t guarantee future returns, but the structural drivers favor continued appreciation. Disclaimer: this is not investment advice – consult a financial advisor.
📌 Key Facts At A Glance
- Gold price history india: 24K gold rate moved from ~₹2,800/g (2016) to ~₹7,800/g (2026) – ~178% gain in 10 years.
- Gold appreciation rate india: ~10.7% CAGR over the past 10 years; long-term average since 2000 is ~12% per year in INR terms.
- Gold rate forecast 2026: most analysts project ₹8,200–8,800/g for 24K by year-end depending on USD/INR and global rates.
- Gold price next 5 years: analyst consensus targets ₹11,000–13,000/g for 24K by 2031 (6–10% CAGR).
- Gold price next 10 years: structural projections suggest ₹15,000–20,000/g for 24K by 2036 if appreciation trends continue.
- Top gold rate increase reasons: rupee depreciation, central bank buying, inflation hedge demand, geopolitical risk, jewellery demand.
- Disclaimer: past performance is not indicative of future results; gold can also fall in nominal terms (e.g., 2013–2015 correction).
Why Your Old Gold Is Worth So Much More Today
If you bought a gold chain in 2016 for ₹50,000 and never thought about it again, walking into a buyer in 2026 would surprise you – that same chain (assuming 22K, ~17g) is now worth roughly ₹1,22,000. Your gold has nearly 2.5x without you doing anything. This isn’t accident or speculation; it’s the predictable outcome of gold rate prediction trends rooted in inflation, currency depreciation, and structural global demand. Understanding gold price history india helps you see what your old jewellery is actually worth today – and helps you make informed decisions about when to sell.
This guide walks through the actual decade-long appreciation, the reasons behind it (gold rate increase reasons), the gold rate forecast 2026, and analyst projections for gold price next 5 years and gold price next 10 years. As always: this is educational, not investment advice; gold can also correct in the short term, and personal financial decisions should involve your advisor.
Gold Price History India: The 10-Year Record
| Year | 24K rate (per 10g) | Notes |
| May 2016 | ~₹28,000 | Post-demonetisation lead-in; weak USD |
| May 2017 | ~₹28,500 | Range-bound year |
| May 2018 | ~₹31,500 | INR weakening to ₹68/$ |
| May 2019 | ~₹32,000 | Pre-COVID; trade tensions |
| May 2020 | ~₹46,500 | COVID surge; safe-haven flight |
| May 2021 | ~₹47,000 | Post-COVID stabilisation |
| May 2022 | ~₹51,000 | Russia-Ukraine conflict premium |
| May 2023 | ~₹62,000 | Banking stress; central bank buying |
| May 2024 | ~₹72,000 | Continued central bank demand |
| May 2025 | ~₹76,000 | Geopolitical premium continues |
| May 2026 | ~₹78,000 | Current market |
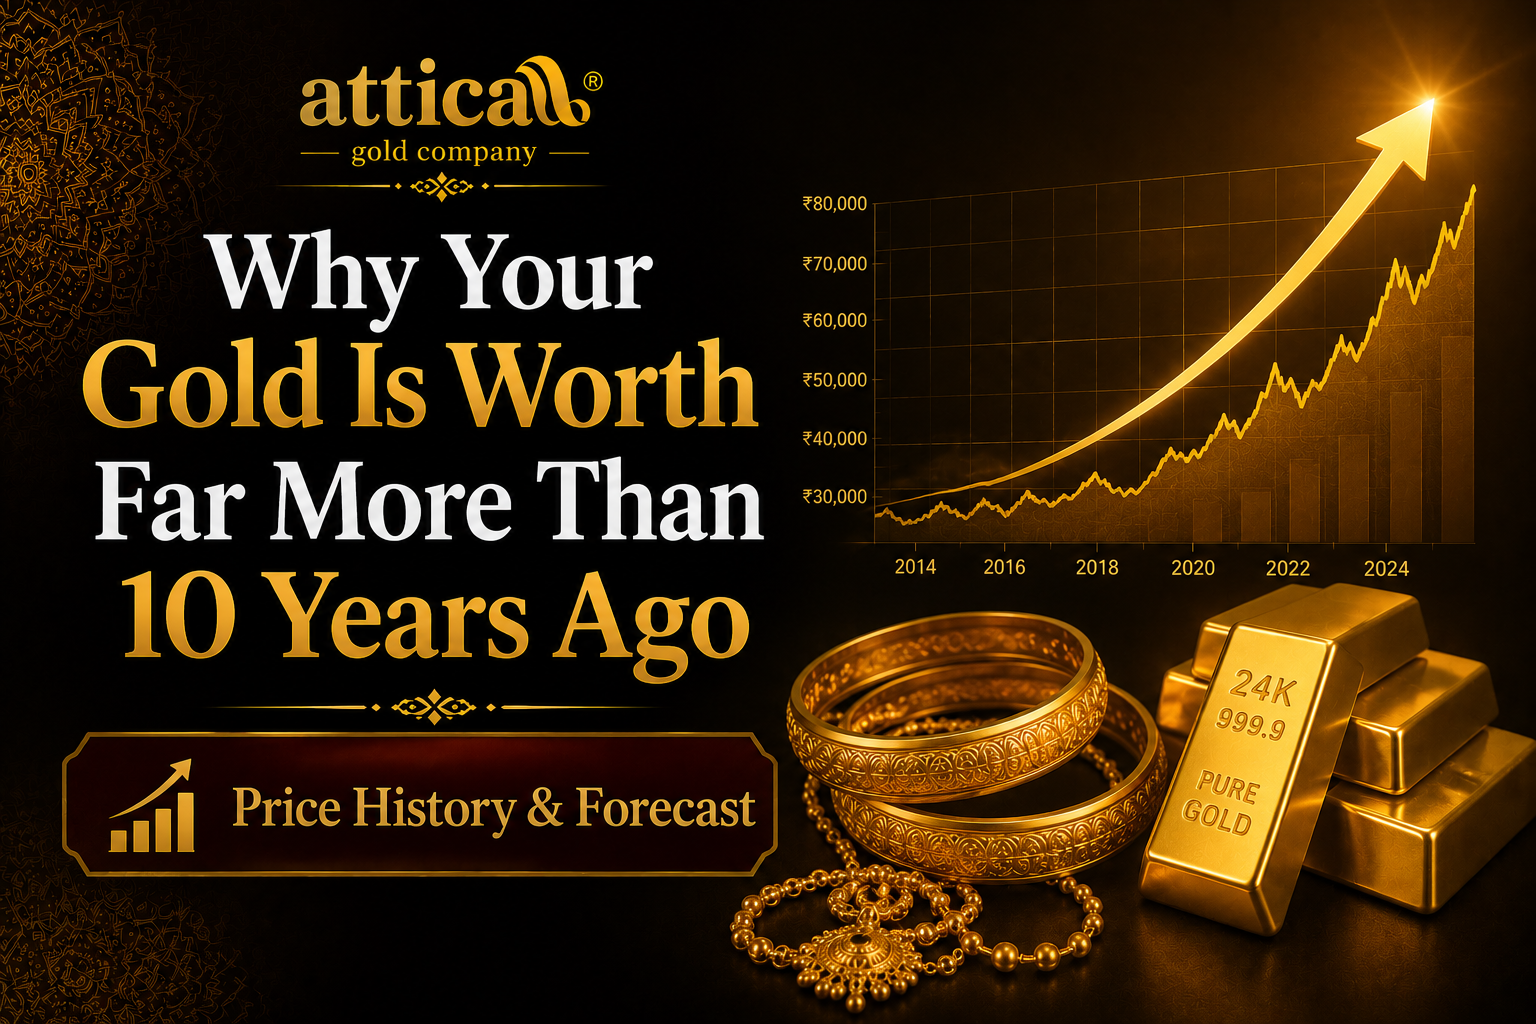
Gold appreciation rate india over this 10-year window: 178% gain in nominal INR terms, or roughly 10.7% per year compounded. This handily beats most fixed-income instruments (FDs averaged 6–7%) and is comparable to large-cap equity index returns over the same period.
- Also Read: Live Gold Price Today
Gold Rate Increase Reasons: What’s Driving the Climb
- Rupee depreciation: INR has weakened from ~67/USD in 2016 to ~83+/USD in 2026 – a ~24% decline against the dollar. Since gold is priced internationally in USD, rupee weakening alone has added ~3% per year to INR gold price.
- Central bank buying: Global central banks (China, Russia, India, Turkey) have aggressively bought gold to diversify away from USD reserves. RBI alone added ~50 tonnes per year in 2022–2025.
- Inflation hedging: Persistent inflation in major economies (US 4–6%, India 5–7% in recent years) has driven institutional and retail demand for gold as a real-asset hedge.
- Geopolitical premium: Russia-Ukraine, Middle East tensions, US-China trade frictions, currency wars – all push safe-haven demand for gold.
- Indian jewellery demand: India consumes ~700 tonnes of gold annually (jewellery + investment), among the world’s largest demand bases.
- Supply constraints: Major gold mines are aging, new discoveries are rare, and ESG concerns slow new mine development. Annual mine output has been roughly flat at ~3,500 tonnes for 5+ years.
- Falling real yields: When inflation-adjusted bond yields are negative, gold (which pays no yield) becomes relatively attractive.
Gold Rate Forecast 2026 and Beyond
Most major banks and research houses publish gold rate forecast 2026 reports. Consensus highlights:
| Time horizon | Forecast range (24K, ₹/g) | Implied annual return |
| End of 2026 | ₹8,200 – 8,800 | 5–13% |
| End of 2028 | ₹9,500 – 10,800 | 6–9% CAGR |
| End of 2031 (5 years) | ₹11,000 – 13,000 | 7–10% CAGR |
| End of 2036 (10 years) | ₹15,000 – 20,000 | 7–10% CAGR |
Important caveat: forecasts are not predictions. The 5- and 10-year ranges reflect what analysts model based on continuing structural trends. Major shocks (a sustained USD strengthening, end of central bank buying cycle, or unprecedented mine output increase) could push prices below forecast. Equally, major escalations (a deeper geopolitical crisis, hyperinflation in major economies) could push prices above. Use forecasts as one input, not as certainty.
Gold Price Next 5 Years: What Analysts Expect
Gold price next 5 years projections cluster around 6–10% per year compounded in INR terms. Major scenarios:
- Base case (~7% CAGR): Continued moderate central bank buying, stable USD-INR around 85, normal inflation regime. 24K rate around ₹11,000/g by 2031.
- Bull case (~10% CAGR): Accelerated dollar de-dollarisation, sustained inflation, geopolitical shocks. 24K rate around ₹13,000/g by 2031.
- Bear case (~3% CAGR): Sharp USD strengthening, end of central bank gold accumulation, mining technology breakthroughs. 24K rate around ₹9,000/g by 2031.
All three scenarios point to higher gold price next 5 years from current levels – the question is by how much, not whether.
💰 Get the Best Price for Your Gold Today
Instant valuation • Transparent pricing • 100% secure & trusted
Gold Price Next 10 Years: Long-Term View
Gold price next 10 years analysis is more speculative but follows similar structural logic. Long-run real returns on gold (after inflation) have historically been 1–2% – modest in real terms. The high INR returns come from rupee depreciation against USD plus India’s inflation premium. Over a 10-year horizon to 2036:
- If structural trends continue (USD-INR weakening, central bank buying, supply constraints): 24K rate of ₹15,000–18,000/g by 2036.
- If real yields normalise sharply (USD strength, end of inflation regime): rate could stagnate around ₹12,000–14,000/g.
- If currency / geopolitical tail risks worsen: 24K rate could exceed ₹20,000/g.
These scenarios assume no major demonetisation-style policy shock (which actually briefly boosted gold demand in 2016) and no major change in tax regime (which can affect held-gold valuations). 2026’s holders of physical gold benefit from the structural setup, but should expect volatility along the way.
What This Means for Your Old Gold Today
If you bought gold 5–10 years ago and have been holding it, current sell rates reflect a meaningful gain. A 22K bangle bought in 2016 for ₹40,000 is now worth ~₹95,000 at sale. After capital gains tax (12.5% LTCG on the gain post-July 2024), you’d net ~₹89,000 – still more than 2x your original outlay. Selling now lets you crystallise this gain into deployable cash; holding longer may compound further but also exposes you to short-term volatility.
There’s no universal right answer. The decision depends on whether you have a specific use for the cash (paying down high-interest debt, funding a goal, emergency reserve), whether you have other liquid savings, and your personal view on gold rate prediction over your relevant time horizon.
Why Choose Attica Gold to Capture Today’s Appreciation – Your Wait Is Over
Gold price history india tells a clear decade-long story: structural forces – central bank buying, rupee depreciation, supply constraints, and geopolitical risk – have driven gold appreciation rate india to roughly 10.7% per year over the past 10 years. Gold rate forecast 2026 and gold price next 5 years projections suggest the trend continues, though never in a straight line. If you’re holding gold purchased years ago, today’s value reflects substantial gains; if you choose to sell, the IBJA-linked rate captures the full appreciation transparently.
Attica Gold is built to make capturing that appreciation effortless: ISO 9001:2015 certified, ~200+ branches across South India, free in-branch XRF testing, IBJA-linked rates updated by 11 AM daily, transparent line-by-line deductions, full GSTIN-stamped invoices, NEFT/RTGS payment within 24 hours. Whether your gold is from 2016 or 2024, we’ll test, valuate, and pay at the current sell-rate that reflects the full decade of price movement. Your wait is over.
Frequently Asked Questions
What is gold rate prediction for end of 2026?
Most analyst gold rate forecast 2026 reports project 24K gold at ₹8,200–8,800 per gram by year-end, depending on USD/INR exchange rate, US Fed policy, and central bank buying patterns. Forecasts are not predictions – actual prices will depend on geopolitical, monetary, and demand factors that evolve in real time. Always check the live IBJA rate before making transaction decisions.
What’s the gold appreciation rate india over the past 10 years?
Approximately 10.7% per year compounded in INR terms, taking 24K from ~₹2,800/g in 2016 to ~₹7,800/g in 2026. Long-run averages (since 2000) are slightly higher, around 12% per year, due to a particularly strong 2008–2012 rally. The 10-year window varies by start date – buying at a peak (e.g., 2012) and selling at a bottom (2015) would have shown losses.
Will gold continue to rise for gold price next 5 years?
Most analyst projections suggest 6–10% per year CAGR for INR gold over gold price next 5 years, supported by continuing central bank buying, USD-INR weakness, and supply constraints. However, gold can also correct (e.g., 2013–2015 saw nominal declines in INR). No projection is guaranteed; consult a financial advisor for personalised allocation guidance.
What are the main gold rate increase reasons?
Major drivers: (1) rupee depreciation against USD adds 2–4% per year passively; (2) global central bank buying (China, Russia, India, Turkey) creates structural demand; (3) inflation hedging demand from institutional and retail investors; (4) geopolitical premium during crises; (5) constrained mine supply; (6) negative real interest rates favoring non-yielding assets like gold.
What’s the gold price next 10 years projection?
Long-range projections cluster around 7–9% INR CAGR, suggesting 24K gold could reach ₹15,000–20,000/g by 2036. This is highly uncertain – 10-year projections depend on structural shifts in monetary policy, currency dynamics, and geopolitical landscape. Treat as scenario analysis, not forecast.
Should I sell my gold now or hold for higher gold rate prediction values?
Depends on your need for cash, alternative investment opportunities, and personal view. If you have high-interest debt (15%+), selling gold to clear it is mathematically attractive even with continued gold appreciation. If you’re holding for long-term wealth preservation and have no immediate cash need, holding through volatility is reasonable. Consult a financial advisor; we cannot give personalised advice.
Where can I track gold price history india daily?
IBJA (ibja.co) publishes daily reference rates for 22K and 24K gold across multiple regions; this is the most authoritative source. MCX (mcxindia.com) shows futures and spot pricing with intraday tick data. World Gold Council publishes longer-term historical series. Always cross-reference at least two sources for important decisions.
Sources & References
This page references and is informed by the following authoritative sources. Last verified: May 2026.
[1] Daily Gold Reference Rate History – India Bullion and Jewellers Association (IBJA). https://ibja.co/
[2] Gold Price Outlook & Quarterly Reports – World Gold Council. https://www.gold.org/
[3] Gold Spot & Futures Pricing – Multi Commodity Exchange (MCX) India. https://www.mcxindia.com/
[4] Central Bank Gold Reserves Data – Reserve Bank of India. https://www.rbi.org.in/
[5] USD-INR Exchange Rate History – Reserve Bank of India – FBIL Reference Rate. https://www.fbil.org.in/
Capture today’s gold price – bring your old gold to Attica
IBJA rate, free XRF, full invoice, NEFT same-day.